Ponder ISD - Historical Information

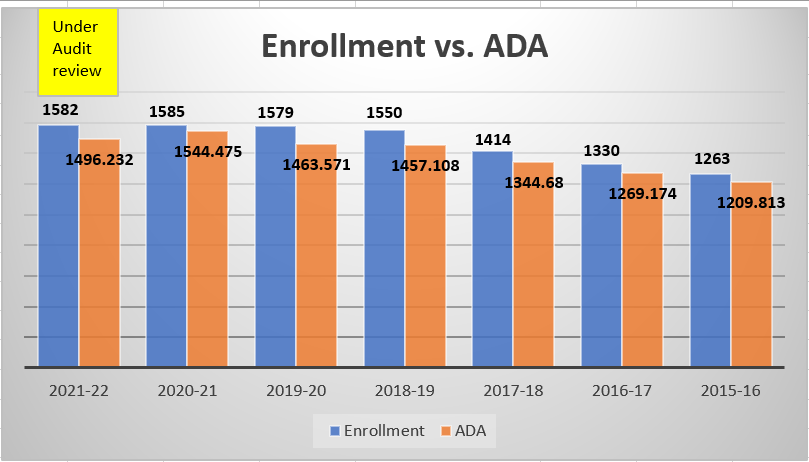
District Enrollment
The PK-12 student enrollment of Ponder ISD has increased significantly in recent years. The enrollment numbers from the past seven school years along with the associated ADA (Average Daily Attendance) are illustrated in the chart below. Currently, the district enrollment for the 2022-23 school year for grades Pre-K through 12 is 1645 students.
District Property Values
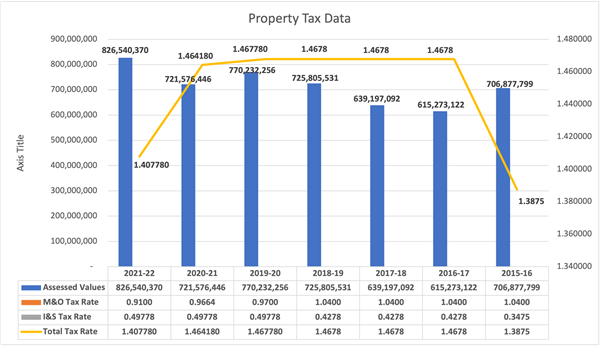
The assessed property values for Ponder ISD, as certified by the Denton Central Appraisal District (DCAD), are detailed in the chart below for the past seven years. The certified assessed values for the current school year as of 7/25/22 were $1,125,069,227, which represents a $298,528,857 (36.1%) increase in assessed values from last year. This significant increase in property valuation is what triggered the required decrease in the district's Maximum Compressed Rate (MCR) - that is, the state funding statutes/formulas require that Ponder ISD must reduce our M&O tax rate to the lowest level of approved M&O tax rates for this school year (which is $0.8056 per $100 of property valuation).
As you will note from the chart below, the district's M&O rate has steadily declined over the past few years - it was $1.04 (per $100/valuation) in 2018-19, and reduced to $0.91 in 2021-22. Without the passage of a VATRE this year, the district's M&O rate will be reduced further to $0.8546. This rate is the combination of the district's MCR of $0.8046 plus an additional $0.05 of "golden pennies" which the district is able to access without a vote. If the VATRE passes in November, the M&O rate would increase to $0.9746, which would add an additional $0.03 worth of golden pennies and $0.09 worth of "copper pennies" - an M&O rate comparable to the district's M&O rate in 2019-20.
You can also see from the chart below that the district's Interest and Sinking (I&S) rate has remained steady for the past few years, at $0.49778. This rate has been near the maximum allowed I&S rate of $0.50 (per $100/valuation), and was maintained at this level to both provide funds to address the district's annual bond payment as well as to provide for an early repayment of the district's bonded indebtedness. The district fulfilled that early repayment goal in February, 2022, by utilizing collected I&S funds to fully pay off the Series 2012 bonds in the amount of $5,179,075, and the Series 2013 bonds in the amount of $2,244,506.25. As a result of the closing of this outstanding debt, coupled with the significant increase in appraised property values in PISD for the coming tax year, the district has determined that a reduction in the I&S tax rate is appropriate, and will provide sufficient revenues to cover our current bond payments for the coming year. As such, the district adopted an I&S rate of $0.3731 (per $100/valuation) for the 2022-23 school year, a reduction of $0.12468 in the I&S rate from last year.
In summary, PISD adopted a total tax rate of $1.40778 (per $100/valuation) for last school year (21-22). The Board of Trustees adopted a total tax rate of $1.3477 ($0.9746 M&O plus $0.3731 I&S) for the 2022-23 school year, which automatically triggered the VATRE due to exceeding the M&O MCR of $0.8546. See Why Call a VATRE? If the VATRE passes, the district tax rate will decrease 6 cents from last year's total rate while providing an estimated $1.4 million in supplemental revenues for M&O (as compared to last year's estimated M&O revenues). If the VATRE does not pass, the district tax rate will decrease 18 cents from last year's total rate, but will not provide any additional M&O revenues for this coming school year (or the years to follow) for the district to utilize for the purposes identified.
District Property Tax Rate Values
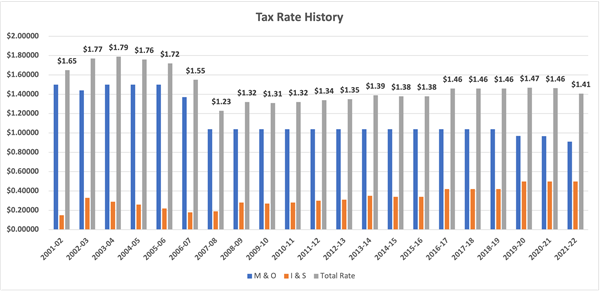
The graph below documents data from the past several fiscal years (since 2001-02) related to the district's tax rates. You can also find the specific tax rate information for each year listed in the table below.
Year | M & O | I & S | Total Rate |
|---|---|---|---|
2001-02 | $1.50000 | $0.15000 | $1.65 |
2002-03 | $1.44000 | $0.33000 | $1.77 |
2003-04 | $1.50000 | $0.29000 | $1.79 |
2004-05 | $1.50000 | $0.26000 | $1.76 |
2005-06 | $1.50000 | $0.22000 | $1.72 |
2006-07 | $1.37000 | $0.18000 | $1.55 |
2007-08 | $1.04000 | $0.19000 | $1.23 |
2008-09 | $1.04000 | $0.28000 | $1.32 |
2009-10 | $1.04000 | $0.27000 | $1.31 |
2010-11 | $1.04000 | $0.28000 | $1.32 |
2011-12 | $1.04000 | $0.30000 | $1.34 |
2012-13 | $1.04000 | $0.31000 | $1.35 |
2013-14 | $1.04000 | $0.35000 | $1.39 |
2014-15 | $1.04000 | $0.34000 | $1.38 |
2015-16 | $1.04000 | $0.34000 | $1.38 |
2016-17 | $1.04000 | $0.42000 | $1.46 |
2017-18 | $1.04000 | $0.42000 | $1.46 |
2018-19 | $1.04000 | $0.42000 | $1.46 |
2019-20 | $0.97000 | $0.49778 | $1.47 |
2020-21 | $0.96640 | $0.49778 | $1.46 |
2021-22 | $0.91000 | $0.49778 | $1.41 |
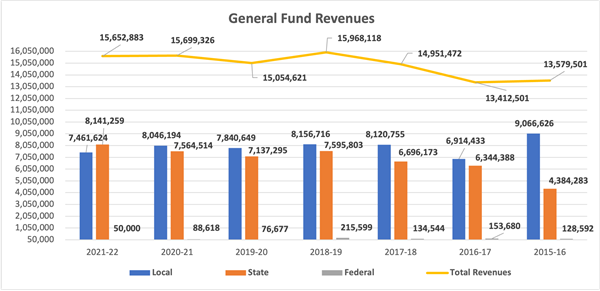
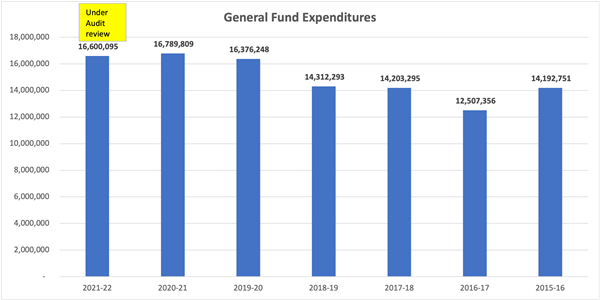
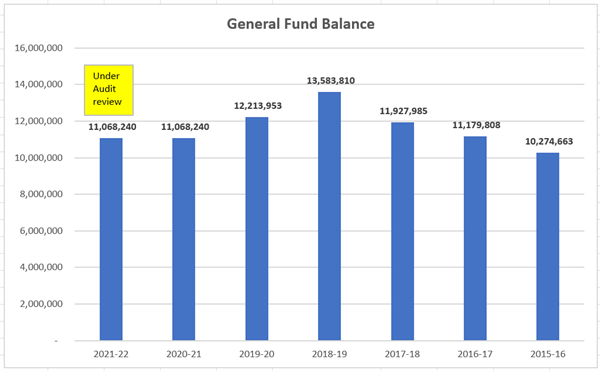
District Revenues, Expenditures, & M&O Fund Balance
The graphs below document data from the past seven fiscal years related to M&O revenues and expenditures, as well as our General Fund Balance for the same years. Note that the values presented for the most recent fiscal year (2021-22) are still unaudited, as our independent financial auditors are still working through their annual process with our business office. This work is generally expected to be completed by November, and will be reported to the Texas Education Agency as required.